
ESA's Debris Index Went From 4 to 50 in a Year. The 50 Is a 100-Year Projection, Not a Measurement.
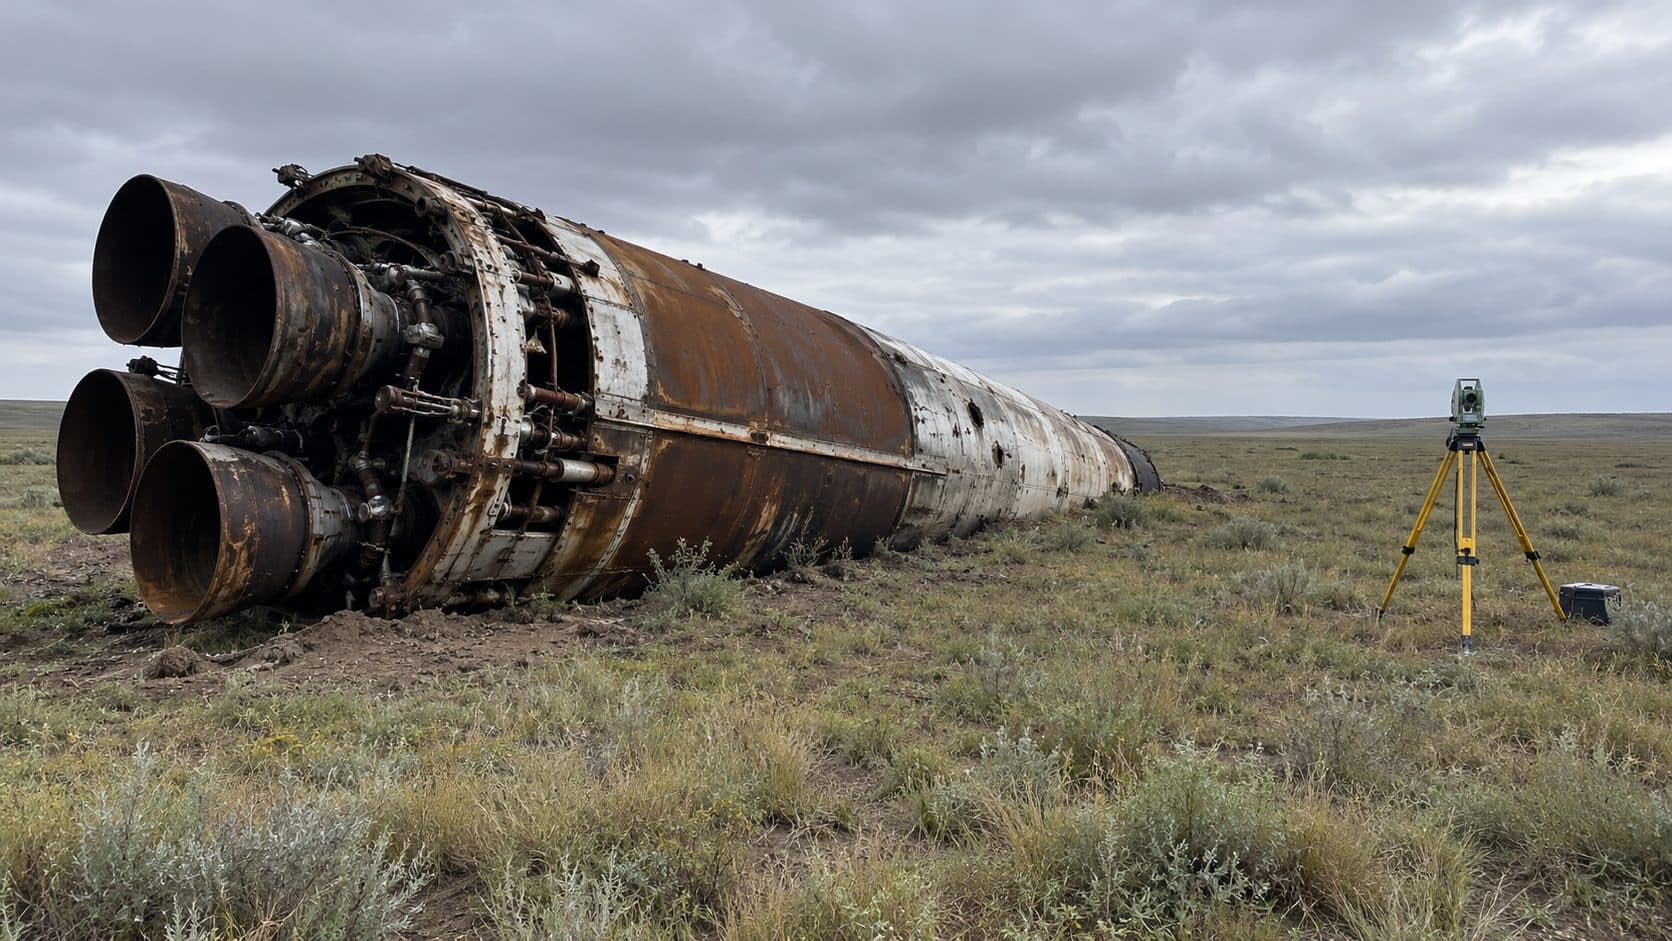
On September 14, 2026, the European Space Agency published the summary of its annual Space Environment Report, built on data up to the end of 2025. One sentence carried the story: "The incredibly large jump of the Index from about 4 to 50 in just one year means that the already beyond sustainable effects of our space activities has worsened an entire order of magnitude within the space of just one year."
The rest of the summary is no calmer. In 2025, more than 300 launches put over 4,000 new payloads into orbit, about ten a day. More than three intact satellites or rocket bodies re-enter the atmosphere every day on average; the report counts 1,200 intact objects re-entering in 2025. ESA's conclusion is that prevention alone is no longer enough: "Active debris removal must become part of the solution and soon."
I am not an orbital engineer. I am the CTO of a LegalTech company built on Claude, and a good part of that job is deciding which numbers a team should act on. A composite index that moves more than tenfold in a year is one I want to read before I quote it. So I read the 152-page report (Issue 10.1, dated September 8), its first issue dated May 1, and the ESA page that introduced the index in October 2025.
What the 50 is a ratio of
Start with one object. ESA scores it as risk equals probability times severity. The probability is that of a catastrophic collision, which depends on how much debris crosses its orbit and on its cross-sectional area. The severity is what its breakup would do to everyone else: ESA simulates the fragment cloud, lets atmospheric drag thin it over time, and adds up the collision probability that cloud imposes over 25 years on a representative set of operational satellites. The score follows the object's orbit for 100 years, including an end-of-life disposal manoeuvre with an estimated success rate for objects that can perform one. Add up every object and you get the environment index.
The 50 is not that index measured on the objects in orbit. It comes out of a simulation: ESA's DELTA-4 model, run 100 times, carries "current behaviour" forward for 100 years from January 1, 2026. Launch traffic from 2017 to 2025 is repeated, with constellations modelled separately from public data on their deployment and replenishment. Disposal succeeds 70% of the time for rocket bodies, 15% for other payloads, and 90% by default for constellation satellites. ESA scores the environment at the end of that century and divides the result by the same score for a reference scenario: launch traffic as in 2014, with a 90% success rate for disposal within 25 years. A value of 1 is the sustainability threshold. ESA's own analogy is the Paris Agreement's 1.5°C.
So the 50 says: if the habits of 2025 continue for a century, the end state would carry about 50 times the risk of the future ESA treats as the first target for sustainability. It does not say orbit is already 50 times more dangerous. The same method applied to the population of 2025 tells a different story: 96% of the current index sits on inactive objects, the largest share on spent rocket bodies (65% on its pie chart), with a visible cluster around 850 km of altitude and 70 to 80 degrees of inclination.
Same report, two numbers
Issue 10.0, dated May 1, 2026, said the risk was "4 times higher" than the threshold. It also said its projection section still used a January 1, 2025 starting point and would be updated "in a subsequent release later in 2026." Issue 10.1, dated September 8, moved the start to January 1, 2026, and the figure became 50.
The update changed more than the starting date. The horizon went from 200 years to 100. A new explosion model, built on survival analysis of historical breakups, ties explosions to the simulated launch traffic. A constellation used to mean at least 20 payloads; it now means at least 10 spacecraft, with large constellations counted shell by shell, which took the count from 26 constellations to 54 constellation or shell-level groups. The September issue also refined how end-of-life compliance is assessed, and some ranges moved between the two issues. Over the last decade, the share of payloads that reached end of life in a non-compliant orbit and then successfully met the 25-year rule went from "between 5 and 85%," with "a rising trend is evident," in May to "between 5 and 50%," with "the level remaining far from targets," in September.
ESA's explanation for the index is explicit: the increase is "primarily driven by the substantially larger future population resulting from the current extrapolation scenario," and the report points to "the growing influence of large constellations." ESA's page also notes that the projected numbers of objects and collisions are "skyrocketing" even though the horizon was cut from 200 to 100 years. An ESA image caption gives the reason for the cut: "practical considerations," the computing demands of the high numbers involved and the difficulty of designing the simulations.
The ruler moved for old points too. In October 2025, ESA wrote that in 2014 "the expected future was already three times riskier" than the threshold, and the May chart agrees. On the September 2026 chart, the 2014 starting point sits a little above 2, and the 2021 and 2022 starts, about 4 and 3.5 in May, sit just below 1, by my reading of the graph. I found no discussion of those shifts in the report.
The 2025 point is the one that matters. The September chart does not just add a 2026 point: it simulates every earlier starting year again, over 100 years and with the new method (the raw values are not the May ones). On that new ruler, the 2025 start still scores about 4, and the 2026 start about 48. ESA's own graphic for the September announcement shows the same values. So, on ESA's own September chart, "from about 4 to 50 in just one year" holds as a comparison of two starting years measured with the same ruler; the new horizon did not produce the jump. The jump sits in the scenario that starts in 2026: by my reading of the charts, about 450,000 objects larger than 10 cm and about 1,750 catastrophic collisions at the end of its century, against about 80,000 and 250 for the 2025 start.
What the report does not claim
ESA's authors are careful, and the PDF carries the caveats the headline drops. The current value "should not be interpreted as a deterministic forecast." The spread across the 100 runs comes from the random modelling of collisions and explosions, not from uncertainty about future launch traffic or constellation plans, which have "a significant influence." The outlook "may improve substantially, or deteriorate further." The executive summary warns that compliance metrics are estimates and that its conclusions "can vary between yearly releases."
What the report does not do is take the 2026 scenario apart. ESA ties the jump to the larger future population of its extrapolation and to large constellations, and an ESA image caption says that, combined with "the increase in constellations being launched," the Kessler runaway effect becomes visible much earlier and feeds "the steep incline of the 2026 line." The report also notes that 2025 marked "the start of systematic deployment of several new large LEO constellations," and its model includes constellation shells once they have "entered systematic deployment," with deployment and replenishment built from public data. How much of the jump comes from the launches of 2025 and how much from the future deployments the model assumes for those constellations, the report does not say. That second part is exactly the uncertainty the spread of the runs leaves out.
Some conclusions do not depend on the exact value. In every extrapolation scenario, the simulated environment keeps deteriorating. Even with no launches after 2025, the number of objects in low Earth orbit grows, because collisions among debris already up there create more. ESA's MASTER model estimates 68,450 objects larger than 10 cm in orbit as of February 1, 2026 (about 11,300 of them active payloads), 1.5 million between 1 and 10 cm, and 230 million between 1 mm and 1 cm.
What I take from it
I build software, not satellites, so these are lessons about numbers, not about orbits.
- Print the denominator next to the number. "50 times" means 50 times a 2014 scenario with 90% disposal success, scored at the end of a simulated century. Without that line, readers supply their own denominator, usually the orbit as it is.
- When you change the method, re-score the past with it before you compare. ESA changed the horizon and the model in September and still kept its headline comparison like for like, because the same chart re-runs the earlier starting years on the new ruler. That chart answers the first question any jump should raise: did the world move, or the formula? In software terms, and only as an analogy, it is re-running last release's benchmark on the new build before comparing scores. If you ship a metric, publish that re-run next to the new value; if you quote one, look for it before you blame the formula.
- Keep the snapshot and the projection on separate lines, because they point to different owners. The current snapshot sits mostly on derelict rocket stages, which argues for removal missions. ESA ties the projected jump to future traffic, large constellations in particular, which argues for disposal reliability designed into satellites before they launch.
- Version the metric and cite the version. ESA does this well: issue and revision numbers, a "notable changes" section for every edition (though the new constellation definition sits in the definitions, not in that list), a written warning about estimates. The weak link is downstream. "ESA's 2026 report" said 4 in May and 50 in September; only "Issue 10.1" is unambiguous. And a 4 is not always the same 4: the May issue's 4 is a 200-year ratio, the September chart's 4 for 2025 a 100-year one. Those two happen to match; the 2014 values, 3 and then a little above 2, do not.
None of this makes the 50 wrong, or comforting. A debris population that grows in every simulated scenario, launches or not, is a result worth acting on, and ESA's Zero Debris approach and its removal and servicing demonstrations are a response to it. But the 50 is ESA's best estimate of where current habits lead, under assumptions it lists and calls uncertain. It deserves to be quoted with them.
Sources
- ESA, "ESA Space Environment Report 2026" (September 14, 2026)
- ESA Space Debris Office, "ESA's Annual Space Environment Report", Issue 10.1, GEN-DB-LOG-00288-OPS-SD (September 8, 2026)
- ESA Space Debris Office, "ESA's Annual Space Environment Report", Issue 10.0 (May 1, 2026)
- ESA, "Health Index, 2026 Space environment report" (image and caption) (September 14, 2026)
- ESA, "Number of objects will skyrocket - 2026 Space environment report" (image and caption) (September 14, 2026)
- ESA, "Sounding the alarm: ESA introduces space environment 'health index'" (October 22, 2025)